LiDAR Map Guide: Where to Find Data, Build 3D Maps, and Choose Sensors for Robotics
Here’s the deal: a lidar map can mean two very different things depending on who is asking. A GIS analyst may be hunting for public elevation data, terrain models, shaded relief layers, Google Earth overlays, or downloadable LAS/LAZ point clouds. A robotics engineer may use the same term for a live 3D perception map generated by a LiDAR sensor mounted on an AMR, UAV, inspection robot, smart camera, or embedded vision system. Both meanings are valid, but the workflows, tools, accuracy targets, and sensor choices are not the same.
This guide connects those two worlds without pretending they are identical. You will see where to find LiDAR map data, how point clouds turn into DEMs, DSMs, depth maps, occupancy grids, and 3D models, and how robotics teams use LiDAR for SLAM, navigation, obstacle avoidance, and real-time environmental perception. For product developers who need an onboard depth-sensing module instead of a public GIS dataset, we also look at the DTOF Solid State LiDAR HM-LD1, a compact solid-state dToF LiDAR module built for real-time depth images and 3D point cloud output.
Table of Contents
- 👉 What Is a LiDAR Map?
- 👉 Main Types of LiDAR Maps
- 👉 Where to Find Free LiDAR Map Data
- 👉 LiDAR Maps for Google Earth, GIS, and 3D Terrain Visualization
- 👉 How to Build a 3D LiDAR Map from Point Cloud Data
- 👉 LiDAR Mapping for Robotics, SLAM, and Embedded Systems
- 👉 How to Choose a LiDAR Sensor for Mapping and Robotics
- 👉 DTOF Solid State LiDAR HM-LD1 for Real-Time Depth Maps and Point Clouds
- 👉 Industrial Applications of LiDAR Maps
- 👉 LiDAR Map Workflow Checklist
- 👉 Common LiDAR Map Mistakes to Avoid
- 👉 LiDAR Map FAQ
What Is a LiDAR Map?
A LiDAR map is a spatial representation built from laser-based distance measurements. The sensor sends out light, reads the reflected signal, and estimates how far surrounding surfaces are from the sensor. Many LiDAR systems use Time-of-flight measurement, where distance is calculated from the time it takes light to travel to a target and return. Depending on the sensor and software stack, the output may become a dense 3D point cloud, a 2D navigation map, a depth image, an elevation model, or a real-time obstacle map.
In geospatial work, a lidar map usually means a terrain or surface product generated from airborne, mobile, or terrestrial LiDAR survey data. These products include bare-earth digital elevation models, digital surface models with trees and buildings, contour lines, hillshade maps, and 3D terrain visualizations. In robotics, a lidar map usually means a local or global representation that helps a machine understand where walls, shelves, pallets, steps, people, docking targets, terrain changes, and safety hazards are located.
LiDAR Map vs. Camera Map vs. Radar Map
Look, each sensing method earns its place. LiDAR is valued because it produces direct geometric measurements. A camera captures texture, color, labels, road markings, cracks, surface defects, and visual features, but it depends heavily on lighting, contrast, lens quality, and image-processing performance. Radar is rugged in fog, dust, rain, and harsh weather, but its spatial resolution is usually lower than LiDAR for compact obstacle mapping. In the shop, real industrial robots often use sensor fusion. LiDAR gives depth and geometry, cameras handle visual recognition, radar adds weather toughness, and inertial sensors help estimate motion when everything is moving.
Point Cloud, Depth Map, DEM, DSM, and Occupancy Grid
A point cloud is a collection of 3D points, usually stored as X, Y, and Z coordinates, sometimes with intensity, timestamp, return number, or color. A depth map is a pixel-like distance image where each value tells the system how far a visible surface is from the sensor. A DEM represents bare-earth elevation after buildings and vegetation are removed. A DSM includes visible surfaces such as rooftops, tree canopy, machines, tanks, conveyors, and infrastructure. An occupancy grid, common in robotics, divides space into cells marked as free, occupied, or unknown. These formats are related, but they serve different jobs: visualization, terrain analysis, navigation, inspection, machine control, or safety logic.
Main Types of LiDAR Maps
The right lidar map workflow depends on how the data is captured and what decision the map must support. A national elevation dataset, a tunnel scan, a warehouse robot map, and a UAV obstacle-avoidance depth frame all use LiDAR principles, but they differ in range, density, update rate, accuracy, coordinate control, and processing load. That is why a sensor or dataset that looks excellent on paper can still be wrong for the actual job.
Airborne LiDAR Maps
Airborne LiDAR maps are collected from aircraft or drones and are widely used for terrain modeling, forestry, flood simulation, corridor mapping, utility planning, transmission line inspection, and environmental analysis. These datasets are commonly delivered in LAS or LAZ formats and may include classification labels for ground, vegetation, buildings, water, bridges, and noise. After processing, airborne LiDAR can produce DEMs, DSMs, hillshade layers, contour maps, canopy height models, slope maps, and large-area 3D terrain products.
For civil and environmental teams, airborne LiDAR is often the cleanest starting point because the data is already georeferenced and may cover large regions. Still, the age of the survey matters. A LiDAR dataset captured five years ago may be fine for broad terrain analysis but unreliable for construction changes, new roads, fresh grading, new buildings, storm damage, or temporary site conditions.
Terrestrial and Mobile LiDAR Maps
Terrestrial LiDAR scanners are mounted on tripods, vehicles, carts, backpacks, robots, or inspection systems. They are useful for road corridors, bridges, tunnels, mines, factories, power plants, construction sites, warehouses, and building documentation. Compared with airborne data, terrestrial scans can capture vertical surfaces, underside details, piping, racks, wall geometry, industrial equipment, and tight indoor features. Registration quality is critical because multiple scans must be aligned into one consistent coordinate system.
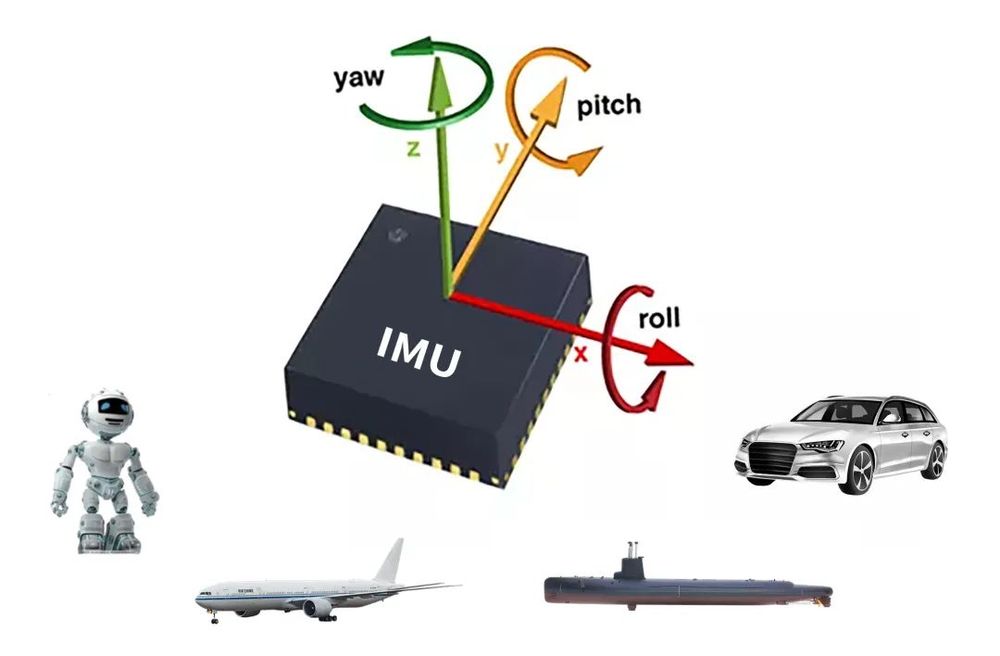
Mobile LiDAR adds another layer of complexity because the sensor is moving during capture. The system must estimate position and orientation while the scan is happening. GNSS, IMU, wheel odometry, visual odometry, and SLAM can all be part of the answer. If the pose estimate is poor, the map may look dense but still be warped, doubled, or offset.
Indoor and Robotics LiDAR Maps
Indoor LiDAR maps support warehouses, laboratories, offices, logistics centers, hospitals, factories, caves, mines, and GPS-denied industrial sites. Robots use these maps for localization, obstacle avoidance, path planning, docking, corridor navigation, shelf approach, pallet detection, and safety monitoring. Unlike public GIS data, robot maps must update continuously because people, carts, doors, forklifts, pallets, and temporary equipment move through the environment.
That real-time requirement changes the engineering conversation. Robotics teams care about frame rate, latency, field of view, interface bandwidth, SDK support, compute load, mounting stiffness, calibration, synchronization, and failure behavior. A beautiful offline point cloud is not enough if the robot cannot process it fast enough to stop before hitting a rack leg.
Real-Time Depth Maps from Solid-State LiDAR
Solid-state dToF LiDAR modules create compact real-time depth images and point clouds without the same mechanical scanning approach used by many larger systems. These modules are especially useful when the goal is local perception instead of national-scale mapping. A compact depth LiDAR can help a robot detect nearby obstacles, measure distance to objects, support UAV altitude hold, monitor a zone, or feed 3D data into an embedded perception algorithm. Component suppliers such as domisensor show how depth-sensing modules are becoming practical building blocks for automation systems, not just lab demonstrations.
Where to Find Free LiDAR Map Data
If your goal is terrain analysis, shaded relief, elevation modeling, hydrology, forestry, or GIS visualization, public lidar map repositories are usually the best starting point. Before downloading anything, check the coordinate system, vertical datum, acquisition date, point density, classification quality, license terms, and available derivative products. In a professional workflow, metadata is not paperwork; it is the difference between a useful map and a misleading one.
USGS 3DEP and National Elevation Data
In the United States, the USGS 3D Elevation Program is one of the most important public sources for elevation and LiDAR-derived data. It provides access to point clouds, DEMs, and related elevation products where coverage is available. Engineers and GIS professionals use this data for watershed analysis, slope mapping, flood modeling, infrastructure planning, route assessment, landslide screening, and terrain visualization. For many projects, a preprocessed DEM or hillshade may be faster and cleaner than raw point cloud data.
The practical advice is simple: start with the derivative product if it already fits the job. If you need a bare-earth surface, a published DEM may save hours of filtering and classification. If you need custom extraction, canopy analysis, building features, or quality checks, then raw LAS or LAZ data gives you more control.
NOAA Coastal LiDAR and Bathymetric Data
NOAA coastal datasets are valuable for shoreline, flood, storm surge, habitat, wetland, and marine-adjacent mapping. Some datasets include topographic LiDAR, and some may include bathymetric LiDAR where water clarity and acquisition conditions allow. Coastal projects require careful attention to vertical datums, tidal references, acquisition dates, and metadata because small elevation differences can significantly affect flood and shoreline interpretation.
In coastal work, do not assume every elevation surface is directly comparable. A mismatch between tidal datum, ellipsoid height, and orthometric height can create bad engineering decisions. That is not a software problem; it is a workflow discipline problem.
State and Local GIS Portals
Many states, counties, cities, and regional planning agencies publish LiDAR data through open-data portals or geospatial clearinghouses. These local portals may provide raw LAS/LAZ point clouds, raster DEMs, contour files, building footprints, classified point clouds, or tiled web map services. Local GIS portals are often excellent for engineering projects because they may contain higher-resolution or more recent data than national datasets.
Local data can be especially helpful for road design, drainage review, subdivision planning, construction estimates, utility corridors, and municipal asset management. Just verify the source and date. A local portal may host several datasets from different acquisition years, resolutions, and processing vendors.
OpenTopography and Academic Repositories
OpenTopography and academic repositories provide research-grade datasets for terrain, geomorphology, earthquake studies, landslides, forestry, erosion, and geoscience applications. These datasets often include detailed metadata and citation requirements. When using academic data, review usage rights, coordinate systems, processing level, vertical accuracy, and whether the dataset is suitable for engineering decisions or mainly intended for research and visualization.
For teams working on embedded robot perception instead of public terrain analysis, LiDAR data sources are different. You may need to collect your own depth frames, point clouds, ROS bag files, or sensor logs from an onboard module. For hardware options, see the DTOF Solid State LiDAR HM-LD1 as an example of a compact module for real-time depth data generation.
LiDAR Maps for Google Earth, GIS, and 3D Terrain Visualization
Many users search for a lidar map because they want to view elevation data in Google Earth or a GIS application. Raw LiDAR point clouds are powerful, but they are not always the easiest format for visualization. High-density LAS or LAZ files can be large, and Google Earth typically does not display raw point clouds the way specialized GIS, survey, or point-cloud software does.
Can You View LiDAR Directly in Google Earth?
In most workflows, LiDAR data is processed before being used in Google Earth. Users typically convert point clouds into DEMs, DSMs, hillshade rasters, color relief layers, contour lines, or image overlays. Those outputs can then be referenced through KML or KMZ workflows. If the goal is detailed point-cloud inspection, tools such as GIS platforms, point-cloud viewers, or engineering software are usually a better fit than Google Earth alone.
Common LiDAR-to-Google-Earth Workflow
A practical workflow starts by downloading LAS or LAZ data from a trusted source. The next step is filtering and classification, especially if a bare-earth terrain model is required. Ground points can be converted into a DEM, while all visible surfaces can be used to create a DSM. From there, the user can generate hillshade, slope, color relief, contours, raster tiles, or image overlays. Finally, the output can be exported or referenced in a KML/KMZ structure for visualization. Alignment should always be checked because coordinate system or projection errors can make a visually convincing overlay spatially wrong.
Best Tools for LiDAR Map Processing
Common tools include GIS platforms, PDAL pipelines, CloudCompare, QGIS, ArcGIS, Python processing libraries, point-cloud libraries, and robotics frameworks such as ROS for sensor streams. GIS tools are strong for DEM, DSM, raster, and coordinate-system workflows. Point-cloud tools are strong for cleaning, registration, downsampling, and inspection. Robotics tools are strong for live mapping, SLAM, occupancy grids, and real-time perception. The right tool depends on whether the lidar map is a static geospatial product or a live machine perception layer.
How to Build a 3D LiDAR Map from Point Cloud Data
Building a 3D lidar map is not just a matter of collecting points. Good maps require clean data, reliable sensor pose, calibration, filtering, registration, and validation. The details vary between GIS and robotics, but the general logic is similar: collect measurements, remove bad data, align scans, convert the data into useful map products, and verify that the map is accurate enough for the decision it supports.
Step 1: Collect or Download Point Cloud Data
You can start with public data or collect your own sensor data. Public GIS data commonly arrives as LAS, LAZ, DEM, DSM, or GeoTIFF files. Robotics data may arrive as ROS bags, PCD files, CSV logs, UVC depth streams, UDP packets, UART frames, or embedded sensor outputs. Metadata is essential. You need to understand coordinate systems, timestamps, sensor pose, calibration, scan angle, acquisition date, return intensity, environmental conditions, and whether the data has already been classified or filtered.
In the shop, this is where many projects either get set up for success or quietly go sideways. If timestamps are sloppy, frames are dropped, or coordinate frames are undocumented, the mapping team spends days chasing errors that should have been controlled during collection.
Step 2: Clean and Classify the Point Cloud
Raw LiDAR data often contains noise, outliers, multipath effects, moving objects, or irrelevant background. Cleaning may include range clipping, statistical outlier removal, voxel downsampling, intensity filtering, reflectivity checks, ground classification, non-ground separation, and removal of isolated points. In robotics, cleaning may also include motion compensation because the sensor and platform may be moving while data is captured.
The point is not to make the prettiest possible cloud. The point is to keep the data that helps the system make the right decision. For a flood model, that may mean a clean bare-earth surface. For an AMR, that may mean a fast, stable obstacle layer that catches pallet edges, people, and rack legs without overwhelming the processor.
Step 3: Register Multiple Scans
Large maps usually require multiple scans or frames. Registration aligns those scans into a consistent spatial frame. Common methods include ICP registration, feature-based alignment, GNSS/IMU-aided alignment, visual-inertial odometry, wheel odometry, loop closure, and pose graph optimization. Registration is one of the biggest drivers of final map quality. Small alignment errors can accumulate into significant drift, especially in long corridors, tunnels, caves, warehouses, mines, and repetitive industrial environments.
Step 4: Generate Map Products
Once point clouds are cleaned and aligned, they can be converted into the format required by the application. GIS users may produce DEMs, DSMs, contours, slope maps, hillshade rasters, meshes, or 3D visualization layers. Robotics developers may generate occupancy grids, OctoMaps, voxel maps, ESDF/TSDF representations, costmaps, depth images, local obstacle maps, or navigation layers. The best output is not always the densest or most visually impressive. A lightweight occupancy grid may be more useful for an AMR than a massive point cloud if the robot needs fast path planning.
Step 5: Validate Accuracy
Validation should include known dimensions, checkpoints, repeatability tests, calibration checks, sensor range tests, and environmental testing. Outdoor sunlight, dark surfaces, reflective materials, glass, dust, rain, vibration, and temperature variation can all influence performance. For safety-critical systems, the lidar map should be validated against required stopping distance, clearance margin, risk zones, and robot failure behavior.
Good validation is practical, not academic. Measure against known targets. Run the robot at real speed. Test in the actual lighting. Put reflective wrap, black plastic, dust, wet concrete, and moving people into the scene if those are part of the real environment. A lab demo is useful, but field behavior is what counts.
LiDAR Mapping for Robotics, SLAM, and Embedded Systems
Robotics changes the meaning of a lidar map. A public map may tell a user what the terrain looked like during a survey, but a robot needs to know what is around it right now. Real-time LiDAR mapping gives machines the geometry they need to move safely through environments that may contain people, carts, pallets, shelves, walls, doors, steps, equipment, vehicles, and unexpected obstacles.
Why Robots Need Real-Time LiDAR Maps
Robots cannot depend only on prebuilt public maps because real environments change. A warehouse aisle may be blocked by a pallet. A drone may encounter a bridge cable or tree branch. A security system may need to detect a person entering a zone. A mobile robot may need to dock with a charger whose position is slightly different from expected. Real-time depth maps and point clouds allow systems to observe these changes and update navigation decisions.
Here’s the deal for product teams: the map is only useful if it arrives in time. A depth frame that is accurate but delayed can still be dangerous. Latency, synchronization, and processing pipeline design matter as much as raw sensor specifications.
SLAM: Simultaneous Localization and Mapping
SLAM allows a robot to estimate its own pose while building or updating a map. LiDAR SLAM is useful indoors, underground, and in GPS-denied areas because it relies on measured geometry rather than satellite positioning. Important concepts include scan matching, odometry fusion, keyframes, loop closure, pose graph optimization, and occupancy mapping. A robust SLAM system usually combines LiDAR with wheel encoders, IMU data, visual sensors, or known landmarks to reduce drift and improve reliability.
2D LiDAR vs. 3D LiDAR vs. Depth LiDAR
A 2D scanning LiDAR is often used for AGV and AMR navigation at a single plane. A 3D multi-beam LiDAR is common in autonomous driving, large-scale mapping, and high-end mobile robotics. A solid-state dToF depth LiDAR is well suited for compact depth imaging, local obstacle detection, presence sensing, near-field 3D perception, and embedded systems where size, weight, power, and integration simplicity matter. Selection should consider field of view, range, resolution, frame rate, latency, power, compute budget, mounting space, interface, and software support.
Real-Time Point Cloud and Depth Map Requirements
Real-time LiDAR mapping depends on more than maximum range. Frame rate affects reaction time. Resolution affects the ability to detect small objects or surface changes. Interface bandwidth determines whether data can move reliably from sensor to processor. SDK support affects development time. Operating temperature, power consumption, mounting rigidity, and calibration stability affect deployment. For compact robots and UAVs, SWaP constraints are often as important as raw sensing performance.
How to Choose a LiDAR Sensor for Mapping and Robotics
Choosing a LiDAR sensor should begin with the application, not with the longest datasheet range. A sensor that works well for shaded-relief terrain mapping may be wrong for a compact indoor robot. A long-range automotive LiDAR may be too large, expensive, or power-hungry for a drone. A compact depth LiDAR may be excellent for local obstacle perception but not appropriate for national-scale survey mapping.
Range and Accuracy
Range determines how far the system can see, but useful range depends on target reflectivity, ambient light, field of view, and required confidence. Indoor and nighttime range may be longer than outdoor daytime range for some optical sensors because sunlight adds background noise. Accuracy should be matched to the task. For obstacle avoidance, ±3 cm can be highly useful when combined with proper safety margins, stopping-distance calculations, and conservative control logic.
Field of View
Field of view determines how much of the scene is visible in each frame. A wide horizontal and vertical FOV supports obstacle awareness and local mapping, while a narrow FOV may be better for targeted distance measurement. Mounting angle matters. A forward-facing sensor can detect obstacles in the direction of travel, while a downward-facing sensor may support altitude hold, landing assistance, floor tracking, terrain following, or bin-level measurement.
Resolution and Frame Rate
Resolution affects how much spatial detail appears in a depth image or point cloud. Frame rate affects how quickly the system reacts to changes. Higher resolution is not always better if the processor, interface, or software cannot handle the data in real time. A compact 40 × 30 depth stream at 10 fps can be practical for embedded obstacle detection, zone monitoring, UAV sensing, and local depth perception where low power, small size, and simpler integration are priorities.
Interface and Platform Compatibility
Interfaces determine how quickly the sensor can be integrated into a real product. UART can be useful for embedded controllers and simple distance or depth data handling. UDP can fit networked systems and robot computers. UVC can support PC-style depth camera workflows. SDK support for Windows, Linux, and ARM Linux can reduce engineering effort when developing on PCs, Raspberry Pi systems, embedded Linux platforms, flight controllers, and robot compute boards.
Size, Weight, and Power
Size, weight, and power are critical for drones, compact AMRs, handheld devices, smart cameras, and battery-powered systems. A large sensor may offer excellent performance but reduce flight time, increase mechanical complexity, or exceed enclosure limits. A compact low-power module may support practical deployment when the sensing task is local perception, obstacle detection, or embedded depth mapping.
DTOF Solid State LiDAR HM-LD1 for Real-Time Depth Maps and Point Clouds
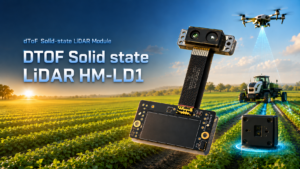
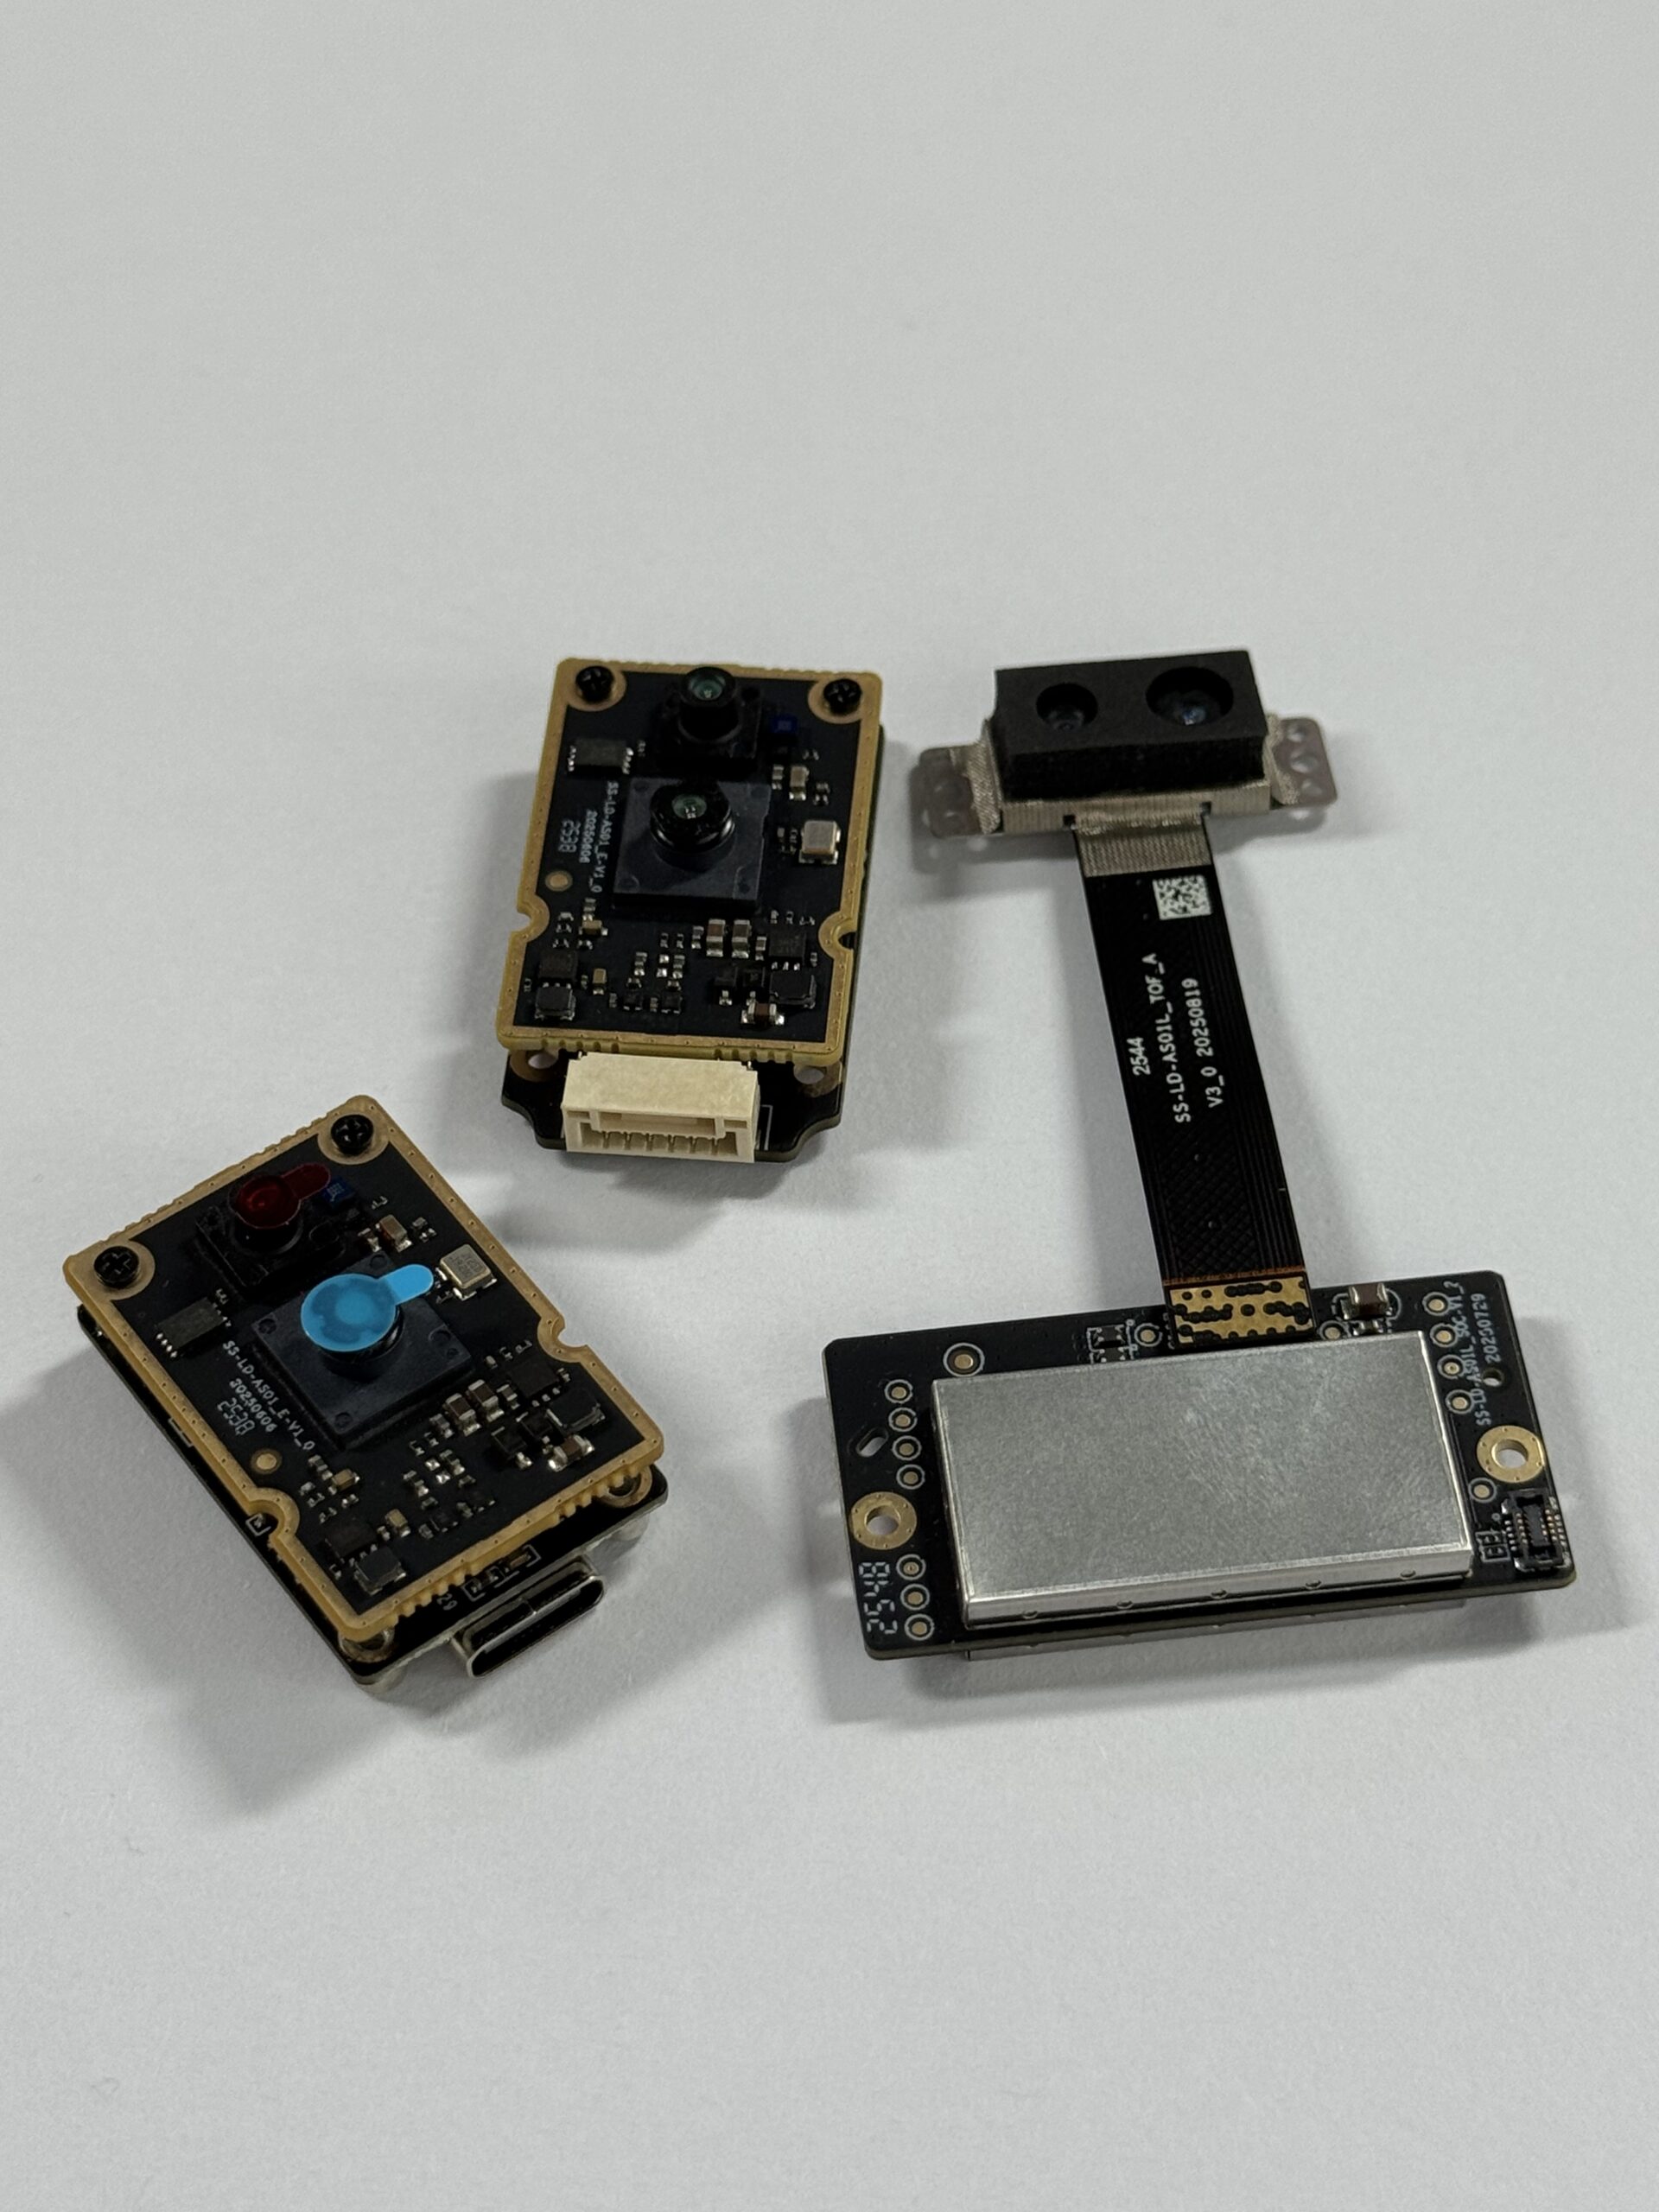
The DTOF Solid State LiDAR HM-LD1 is a compact SPAD dToF LiDAR module for real-time depth imaging and 3D point cloud data. It is designed for applications such as obstacle avoidance, distance detection, autonomous navigation, smart inspection, robotic vision development, UAV sensing, zone monitoring, and embedded 3D perception. For teams building a practical lidar map on a robot or drone, HM-LD1 is relevant because it produces live depth data instead of relying on historical public survey datasets.
HM-LD1 supports indoor or nighttime ranging up to 25 m and outdoor daytime ranging up to 8 m, with a stated ranging accuracy of ±3 cm. Its compact size, 28 g weight, 1.2 W power consumption, 60° horizontal × 45° vertical field of view, and UART/UDP/UVC interfaces make it suitable for integration into compact robots, UAVs, smart cameras, and embedded systems. MRP also offers SDKs for x86 Windows, x86 Linux, and ARM Linux, helping developers move from prototype testing to deployment across common computing platforms.
HM-LD1 Dimensions and Ranging Specifications
| Specification | HM-LD1 Value |
|---|---|
| Dimensions | 43.5 mm × 30 mm × 26.5 mm |
| Ranging Capability | Indoor: 0.5–25 m; Outdoor: 0.2–8 m |
| Ranging Accuracy | ±3 cm |
| Field of View | 60° horizontal × 45° vertical |
| Weight | 28 g |
HM-LD1 Product Details
| Specification | HM-LD1 Value |
|---|---|
| Resolution | 40 × 30 |
| Frame Rate | 10 fps |
| Interface | UART / UDP / UVC |
| Operating Temperature | -20 ℃ to 60 ℃ |
| Power Consumption | 1.2 W |
For detailed integration information, you can Download the DTOF SSL HM-LD1 Product Brochure.
View Product Details & Pricing ➔
Why HM-LD1 Fits Compact Robotics and UAV Mapping
HM-LD1 is especially relevant when space, weight, and power are limited. At 28 g and 1.2 W, it can support battery-powered systems where every gram and watt matters. Its 60° × 45° field of view supports forward obstacle perception, local depth mapping, and zone monitoring. UART, UDP, and UVC interfaces provide flexibility for embedded controllers, networked robot computers, and PC-style development environments. SDK availability for x86 Windows, x86 Linux, and ARM Linux further supports prototyping and deployment.
Where HM-LD1 Is Not a Replacement for Survey LiDAR
HM-LD1 should not be treated as a replacement for national-scale airborne survey LiDAR or high-density long-range terrestrial scanning systems. It is better suited for real-time local perception, compact robotic sensing, UAV distance measurement, obstacle avoidance, zone detection, robotic vision development, and embedded 3D sensing. This distinction matters because selecting the right LiDAR depends on whether the project needs a large-area geospatial survey or a live perception layer for a moving machine.
Industrial Applications of LiDAR Maps
LiDAR maps are used wherever machines or engineers need reliable spatial understanding. The same underlying measurement principle supports civil terrain analysis, robot navigation, infrastructure inspection, security systems, UAV control, asset monitoring, and digital-twin development. Industrial success depends on matching the map type and sensor to the environment, not just buying the most impressive spec sheet.
Autonomous Mobile Robots and Warehouse Navigation
AMRs and AGVs use LiDAR for obstacle detection, aisle navigation, localization, docking, pallet detection, and safety-zone monitoring. A robot may use a 2D occupancy grid for path planning while also using a depth map or 3D point cloud to detect objects above or below the main scanning plane. In dynamic warehouses, real-time mapping helps robots react to moving people, forklifts, carts, and temporarily placed goods.
In practical deployments, the hard problems are often ordinary shop-floor problems: shrink wrap, glossy floors, uneven lighting, narrow aisles, dangling straps, open dock doors, and people who do not behave like test fixtures. LiDAR mapping helps, but it still needs thoughtful mounting, calibration, and validation.
UAV Altitude Hold, Terrain Following, and Obstacle Avoidance
UAVs use LiDAR for low-altitude sensing, terrain following, landing assistance, bridge inspection, dam inspection, and obstacle avoidance. Compact sensing is especially important because added weight affects flight time and payload capacity. Outdoor use requires validation in sunlight, shade transitions, reflective surfaces, dark targets, and changing weather conditions. A compact dToF LiDAR can be useful when the UAV needs local depth awareness rather than long-range survey capture.
Smart Inspection for Infrastructure
LiDAR supports inspection of bridges, expressways, dams, industrial assets, tunnels, and hard-to-access structures. Public or survey-grade lidar maps may provide large-area context, while onboard LiDAR helps inspection robots or UAVs measure distance to surfaces and avoid collisions during operation. For assets that are difficult or risky for people to approach, distance measurement and local 3D perception improve safety and repeatability.
Security, Presence Detection, and Zone Monitoring
Depth-based sensing can support intrusion zones, people detection, object detection, volume measurement, and privacy-sensitive monitoring. Compared with RGB cameras, LiDAR can provide geometric presence information without relying on detailed visual imagery. This can be valuable in smart buildings, industrial safety zones, retail analytics, access control, machine guarding, and controlled work cells.
Caves, Mines, and GPS-Denied Mapping
Caves, mines, tunnels, and underground spaces are classic LiDAR mapping environments because GNSS is unavailable and lighting may be poor. LiDAR can measure geometry in darkness, but dust, moisture, reflective surfaces, narrow passages, and irregular rock surfaces can still create challenges. SLAM, robust registration, sensor fusion, and careful validation are essential for reliable maps in these environments.
LiDAR Map Workflow Checklist
A successful lidar map project begins with a clear definition of the output and decision requirement. If the project needs a GIS elevation product, the workflow may focus on public data, coordinate systems, ground classification, and raster generation. If the project needs real-time robot perception, the workflow must focus on sensor selection, latency, calibration, interface, frame rate, mounting, and runtime performance.
- ✅ Define whether the project needs GIS mapping, survey visualization, or real-time robotic mapping.
- ✅ Choose public datasets or onboard sensor collection based on whether the environment is static or dynamic.
- ⚙️ Confirm required range, accuracy, map resolution, field of view, frame rate, and latency.
- ⚙️ Select the output format: DEM, DSM, point cloud, occupancy grid, depth image, voxel map, mesh, or costmap.
- ⚙️ Validate coordinate systems, vertical datums, calibration, mounting angle, and timestamp synchronization.
- ⚙️ Confirm compute platform, interface, SDK support, power budget, and enclosure constraints.
- ✅ Test under real lighting, reflectivity, weather, dust, vibration, temperature, and motion conditions.
- ✅ Document accuracy limits, environmental limits, safety margins, and maintenance requirements.
Common LiDAR Map Mistakes to Avoid
Many lidar map problems are caused by mismatched assumptions rather than bad technology. A dataset may be accurate but outdated. A sensor may have sufficient range but insufficient field of view. A map may look correct but use the wrong coordinate system. A robot may perform well in a lab but fail in sunlight or on reflective flooring. Avoiding these mistakes early saves engineering time and reduces deployment risk.
Confusing Public LiDAR Data with Real-Time Robot Perception
Public LiDAR datasets are usually static snapshots of a location at a previous date. They are useful for terrain analysis and planning, but they do not show current obstacles, moving people, temporary equipment, open doors, new construction, or dynamic hazards. Robots need onboard sensing to perceive the present environment.
Ignoring Coordinate Systems and Calibration
Coordinate-system errors can make GIS overlays misalign, and calibration errors can make robot obstacles appear in the wrong place. Extrinsic calibration between LiDAR, camera, IMU, and robot base frames is especially important for SLAM and navigation. Even a small angular error can produce significant positional error at distance.
Choosing a Sensor by Range Alone
Maximum range is only one specification. Field of view, accuracy, repeatability, frame rate, resolution, power, interface, software support, operating temperature, mounting constraints, and environmental robustness all affect real performance. The best LiDAR sensor is the one that meets the complete system requirement.
Underestimating Outdoor Light Conditions
Sunlight affects optical sensing. Some LiDAR modules specify different indoor and outdoor ranging capabilities because strong ambient light can reduce effective range. Engineers should test sensors in the actual deployment environment, including direct sun, shade, dark surfaces, reflective objects, rain, dust, and temperature changes.
LiDAR Map FAQ
Where can I get free LiDAR map data for the USA or Google Earth overlays?
How do I get LiDAR and elevation data to create shaded relief or 3D terrain maps?
Can LiDAR be used to create maps for caves, robots, or indoor navigation?
What is the difference between a LiDAR point cloud and a LiDAR map?
What file formats are used for LiDAR maps?
Is LiDAR better than photogrammetry for 3D mapping?
What LiDAR sensor specifications matter most for robotic mapping?
Can a compact dToF LiDAR create a full 3D map?
How accurate does a LiDAR map need to be?
Can LiDAR maps work outdoors in sunlight?
How do robots use LiDAR maps for navigation?
What is the best LiDAR map workflow for product developers?
📚 References & Further Reading
- Industry Standard: Time-of-flight measurement overview
- Related Guide: DTOF Solid State LiDAR HM-LD1 product details
- Sensor Reference: domisensor depth sensing and perception components
- Product Brochure: DTOF SSL HM-LD1 Product Brochure